How to Publish Request Metrics to AWS CloudWatch from Spring Boot
Ever wondered what’s the easiest way to publish Spring Boot request metrics to CloudWatch in AWS? In this article I explain the most common way to gather Spring Boot request metrics such as request timing and response status codes, then publish and plot the data in AWS.
Prerequisites
- AWS Account
- Spring Boot
Dependencies
The application I am using in this article uses Spring Boot version 2.1.18.RELEASE, however the steps should be relatively similar for newer Spring Boot versions. Please note that these are the dependency versions that work for me for me based on my Spring Boot version.
- org.springframework.boot:spring-boot-starter-actuator
- software.amazon.awssdk:cloudwatch:2.17.281
- io.micrometer:micrometer-core:1.5.17
- io.micrometer:micrometer-registry-cloudwatch2:1.5.17
Micrometer
Before we move on it’s important to talk about a library closely related to gathering metrics in Spring Boot. The most common way to gather metrics is through micrometer. Fundamental to micrometer is the concept of a “meter” which is an abstraction for collecting metrics data. Meters can be dimensional to allow for various tracking across time, and supports a wide range of data types such as timers, counters and gauges.
Gathering Metrics
Spring Boot Actuator does most of the legwork involved with collecting request metrics, although some configuration is required to get metrics production ready.
In my application, I want to enable the least amount of metrics possible so that I won’t be spamming CloudWatch with metrics I’m not interested in. This keeps the data relatively clean, and is more scalable since you pay for the metrics you send to CloudWatch. The following configuration disables all metrics except for the request metrics I am interested in:
management:
    metrics:
        enable:
            all: false
            http.server.requests: true
Next, we need to expose these metrics so that AWS can fetch them. Luckily, Actuator provides us with another simple configuration parameter:
management:
    endpoints:
        web:
            exposure:
                include: metrics
All request metrics can now be accessed ${base_url}/actuator/metrics. When our application goes to publish metrics to AWS, it will use this endpoint to do so.
Publishing Metrics
For simplicity, we will be connecting to AWS using an access and secret key in plain text. In an ideal world, we would inject these secrets into our Spring application using some sort of secret manager like AWS Secrets Manager, however this could be a whole blog post in itself.
In the following code, we are going to do two things:
- Build the CloudWatch client in our application by authenticating the application with our AWS account.
- Create the MeterRegistry where our metrics will be registered and stored in our application before they are sent at intervals to AWS.
@Component
public class CloudWatchUtil {

    private CloudWatchAsyncClient cloudWatch;

    @Bean
    private MeterRegistry meterRegistry() {

        AwsCredentials awsCreds = AwsBasicCredentials.create("aws-access-key", "aws-secret-key");
        StaticCredentialsProvider scp = StaticCredentialsProvider.create(awsCreds);

        CloudWatchAsyncClientBuilder builder = CloudWatchAsyncClient.builder()
            .credentialsProvider(scp)
            .region(Region.of("aws-region"));

        cloudWatch = builder.build();

        CloudWatchConfig cloudWatchConfig = new CloudWatchConfig() {

            @Override
            public String get(String key) {
                return null;
            }

            @Override
            public String namespace() {
                return "my-namespace";
            }

        };

        return new CloudWatchMeterRegistry(cloudWatchConfig, Clock.SYSTEM, cloudWatch);
    }
}
The CloudWatchConfig is a micrometer paradigm for customizing the CloudWatchMeterRegistry. You can use it to customize the registry. This documentation from micrometer explains how to do this. Returning null in get(String key) keeps all the defaults which sends metrics every minute to CloudWatch in the namespace().
Plotting Metrics
Metrics are published in two different units to CloudWatch.
http.requests.countis singular unit (called count) of HTTP requests.http.requests.avg,http.requests.maxandhttp.requests.minare all request timings in milliseconds.
Each request is tagged so that you can group them with the following information:
- Response status code.
- URI being called.
- Exception (if any).
- HTTP method.
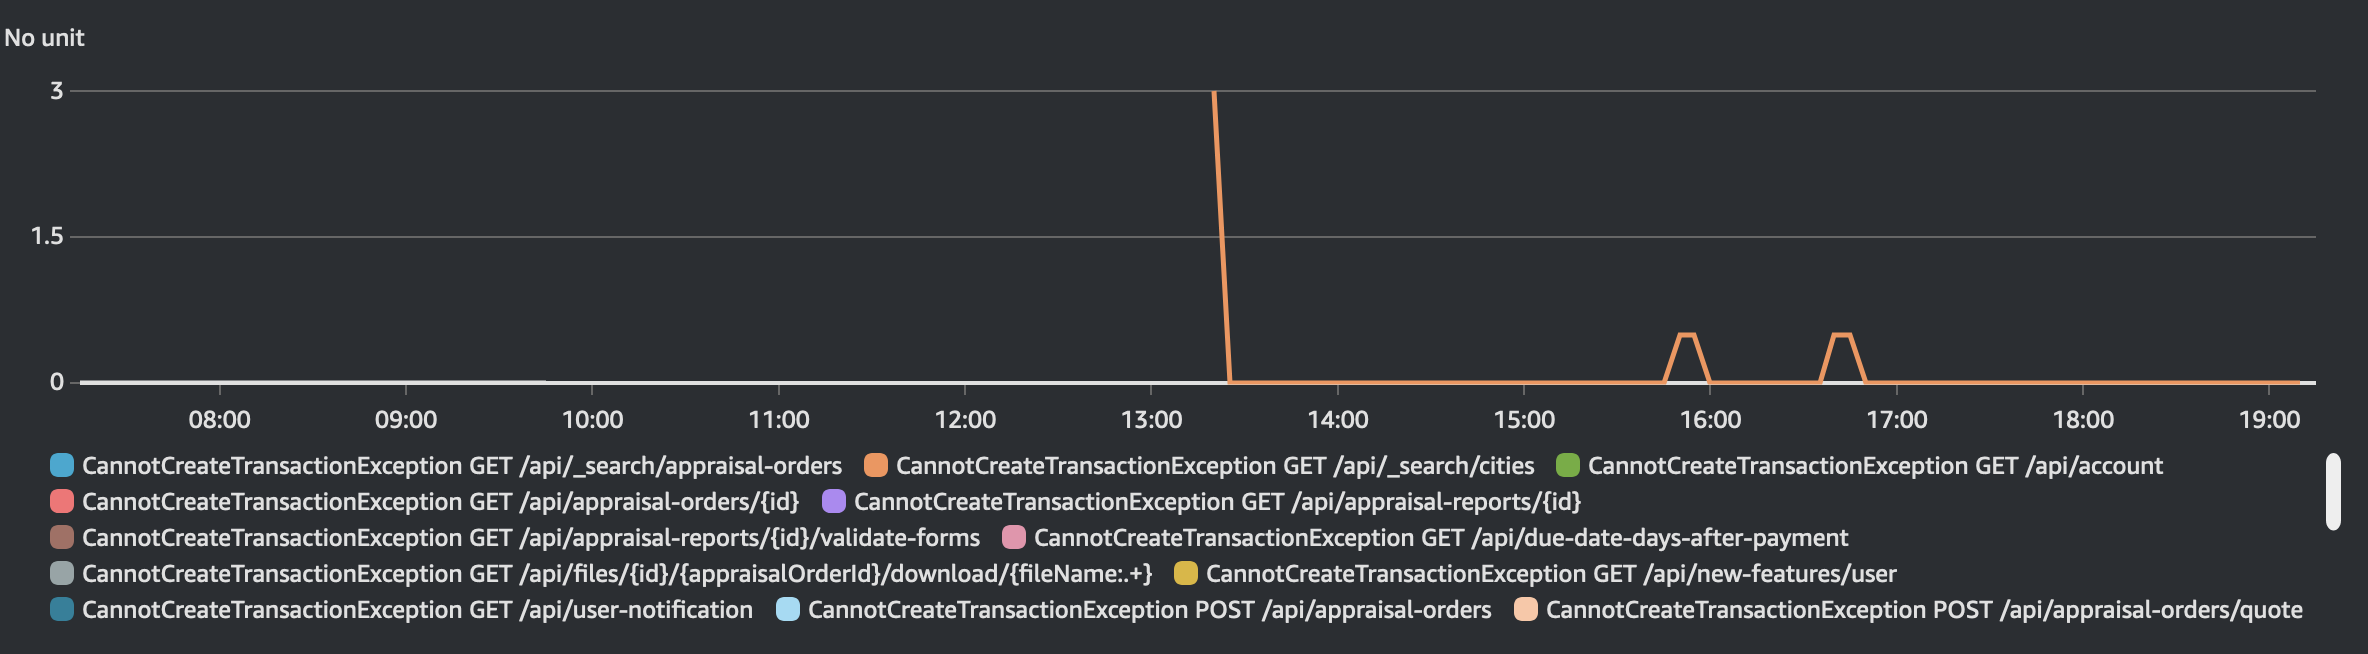
For example, I plotted a graph that shows the number of times a URI returns the 500 status code:
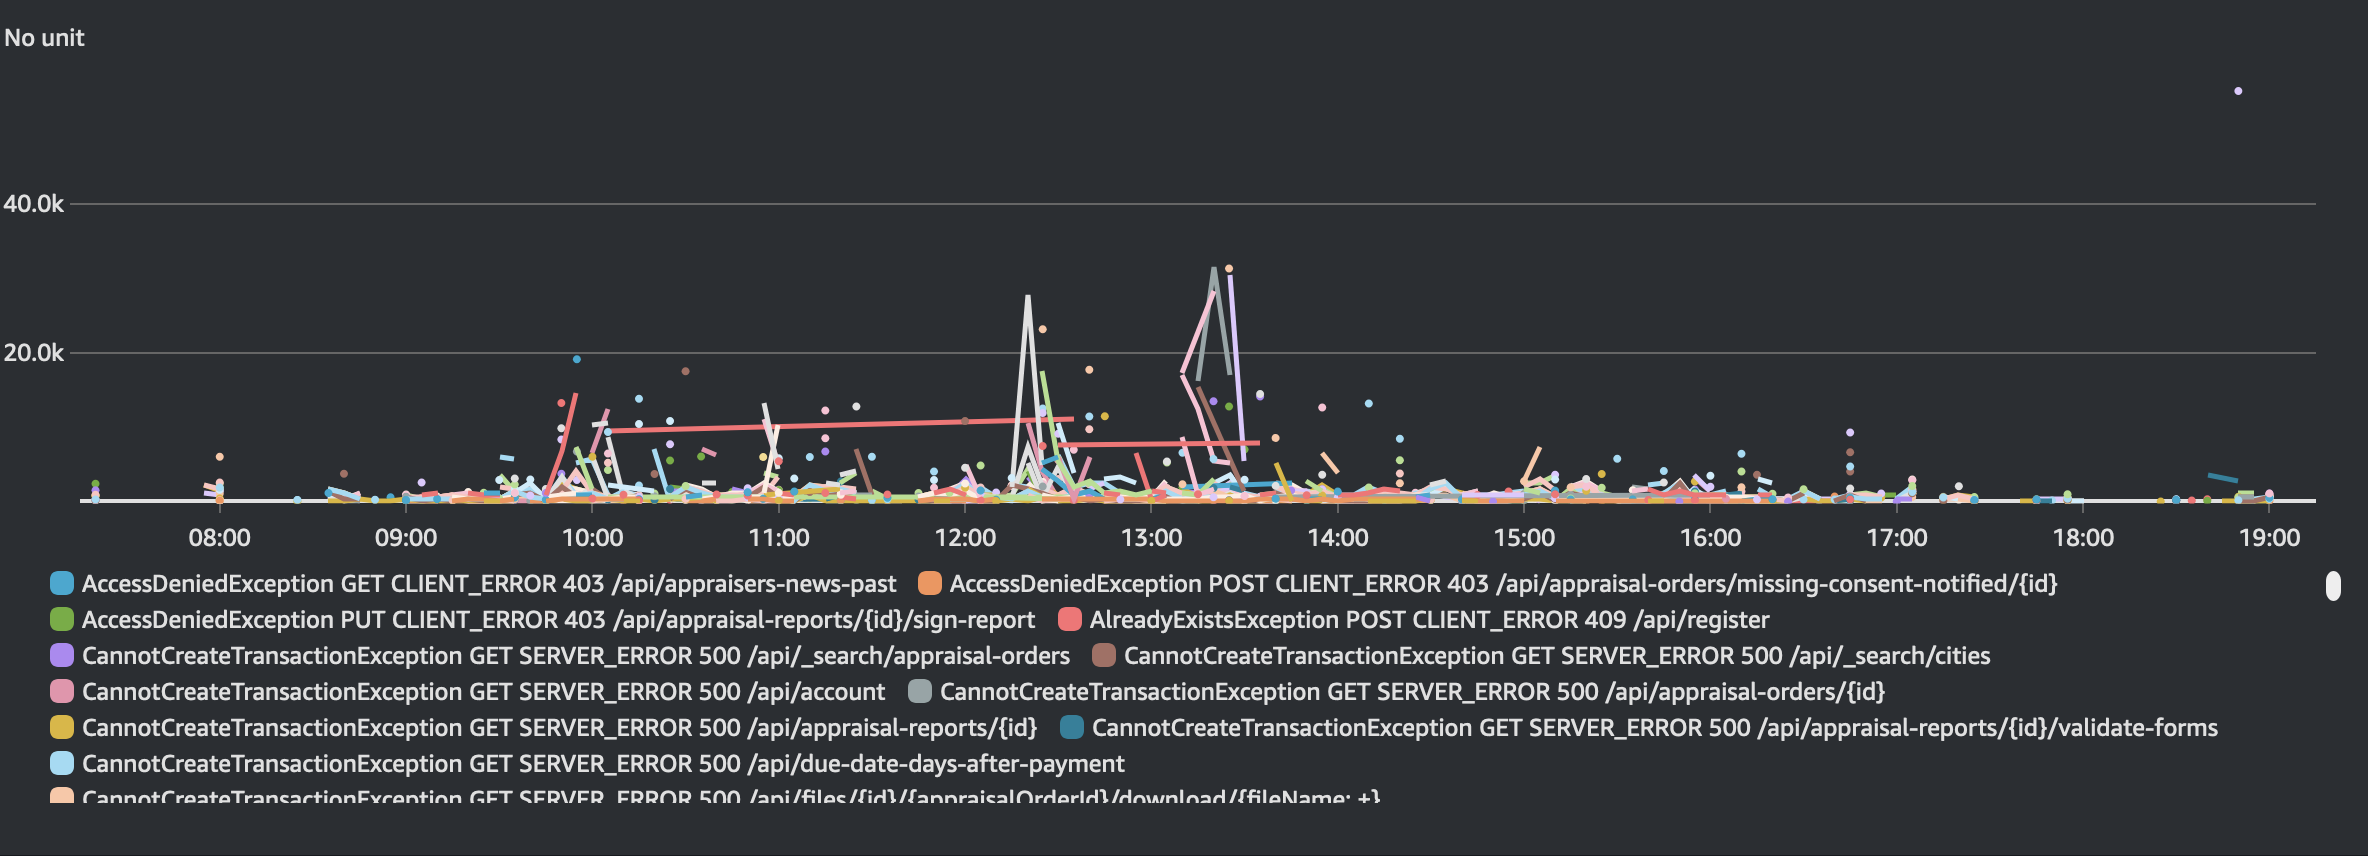
I also plotted a graph that shows the average request timing for each URI:
Future Improvements and Considerations
As mentioned earlier, it would be best to inject your AWS secrets at run-time via a secret manager or using environment variables. This can be done by incorporating an AWS secret manager dependency (similar to the CloudWatch dependency) to securely import your secrets at run-time.
Have any comments or improvements on the above article? Let me know by submitting a Pull Request on this website’s GitHub repository.